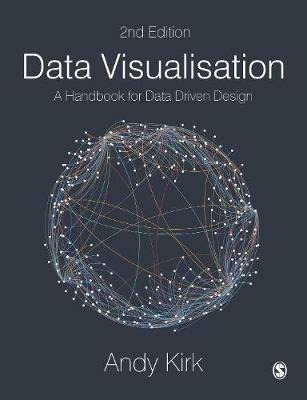
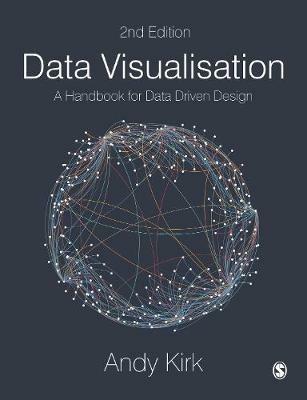
Data Visualisation: A Handbook for Data Driven Design
One of the "six best books for data geeks" - Financial Times With over 200 images and extensive how-to and how-not-to examples, this new edition has everything students and scholars need to understand and create effective data visualisations. Combining ‘how to think’ instruction with a ‘how to produce’ mentality, this book takes readers step-by-step through analysing, designing, and curating information into useful, impactful tools of communication. With this book and its extensive collection of online support, readers can: Decide what visualisations work best for their data and their audience using the chart gallery See data visualisation in action and learn the tools to try it themselves Follow online checklists, tutorials, and exercises to build skills and confidence Get advice from the UK’s leading data visualisation trainer on everything from getting started to honing the craft.
-
Autore:
-
Editore:
-
Anno:2019
-
Rilegatura:Hardback
-
Pagine:328 p.
Le schede prodotto sono aggiornate in conformità al Regolamento UE 988/2023. Laddove ci fossero taluni dati non disponibili per ragioni indipendenti da Feltrinelli, vi informiamo che stiamo compiendo ogni ragionevole sforzo per inserirli. Vi invitiamo a controllare periodicamente il sito www.lafeltrinelli.it per eventuali novità e aggiornamenti.
Per le vendite di prodotti da terze parti, ciascun venditore si assume la piena e diretta responsabilità per la commercializzazione del prodotto e per la sua conformità al Regolamento UE 988/2023, nonché alle normative nazionali ed europee vigenti.
Per informazioni sulla sicurezza dei prodotti, contattare productsafety@feltrinelli.it


