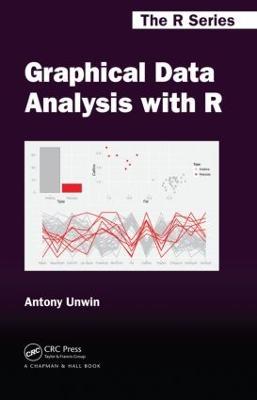
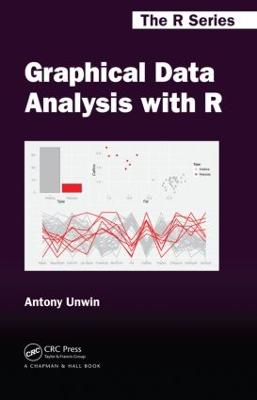
Graphical Data Analysis with R
See How Graphics Reveal Information Graphical Data Analysis with R shows you what information you can gain from graphical displays. The book focuses on why you draw graphics to display data and which graphics to draw (and uses R to do so). All the datasets are available in R or one of its packages and the R code is available at rosuda.org/GDA. Graphical data analysis is useful for data cleaning, exploring data structure, detecting outliers and unusual groups, identifying trends and clusters, spotting local patterns, evaluating modelling output, and presenting results. This book guides you in choosing graphics and understanding what information you can glean from them. It can be used as a primary text in a graphical data analysis course or as a supplement in a statistics course. Colour graphics are used throughout.
-
Autore:
-
Editore:
-
Collana:Chapman & Hall/CRC The R Series
-
Anno:2015
-
Rilegatura:Hardback
-
Pagine:312 p.
Le schede prodotto sono aggiornate in conformità al Regolamento UE 988/2023. Laddove ci fossero taluni dati non disponibili per ragioni indipendenti da Feltrinelli, vi informiamo che stiamo compiendo ogni ragionevole sforzo per inserirli. Vi invitiamo a controllare periodicamente il sito www.lafeltrinelli.it per eventuali novità e aggiornamenti.
Per le vendite di prodotti da terze parti, ciascun venditore si assume la piena e diretta responsabilità per la commercializzazione del prodotto e per la sua conformità al Regolamento UE 988/2023, nonché alle normative nazionali ed europee vigenti.
Per informazioni sulla sicurezza dei prodotti, contattare productsafety@feltrinelli.it


